How and why do microstats matter? A conversation with Corey Sznajder


When people talk about hockey “analytics,” they're generalizing part of the sport that is just as varied as more traditional spheres. It's hardly a monolith, by any means.
There are team analytics departments, which take on tasks as diverse as prospect evaluation, pro scouting, and tactical determinations; there are private firms such as SportLogiq, Stathletes, and ClearSightAnalytics that offer third-party data to teams and broadcasters; there are public “macro-level” analysts who scour the NHL's publicly-available data and create metrics to assess players and teams; there are writers and visualizers who review the results and communicate these findings to hockey fans.
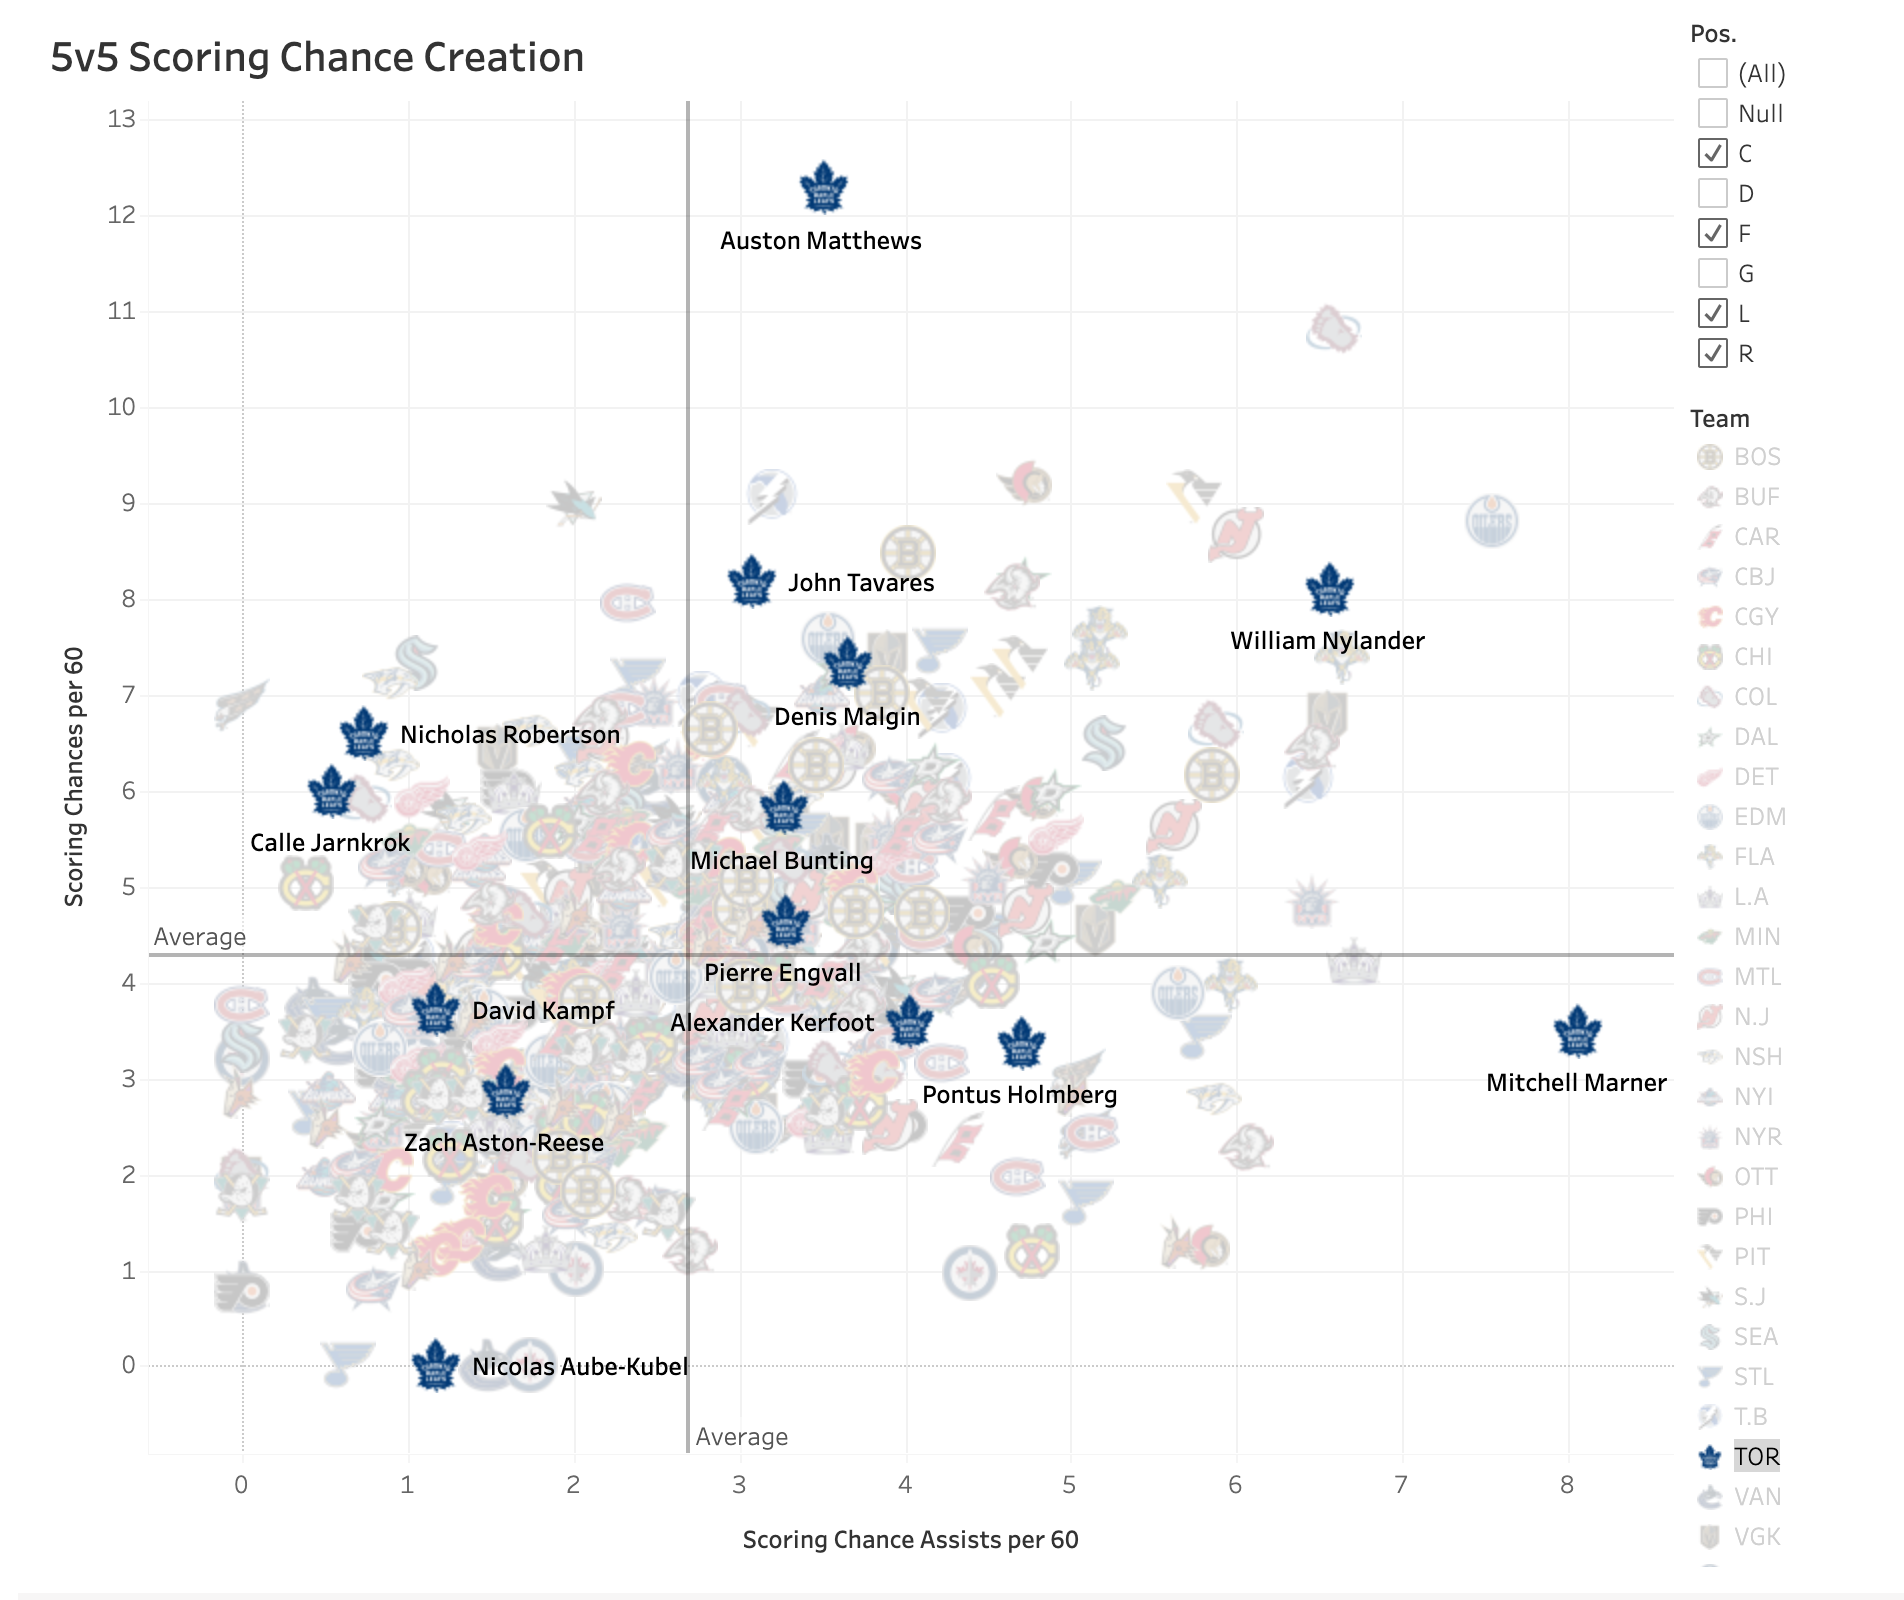
But there's one player in the public hockey analytics sphere whose work is completely unique: Corey Sznajder. His AllThreeZones project, which began in 2016-17, aims to go beyond the NHL's limited data and offer consistent and reliable “microstats” on pre-shot passing, transition play, rush defence, puck retrievals, and plenty more. Sznajder has essentially translated his own eye test (developed through thousands of games of extremely attentive viewing) into an intuitive database that gives fans access to the type of information that would otherwise be exclusive to NHL teams and private companies.
Sznajder makes these stats available to Patreon supporters on his website, www.AllThreeZones.com,

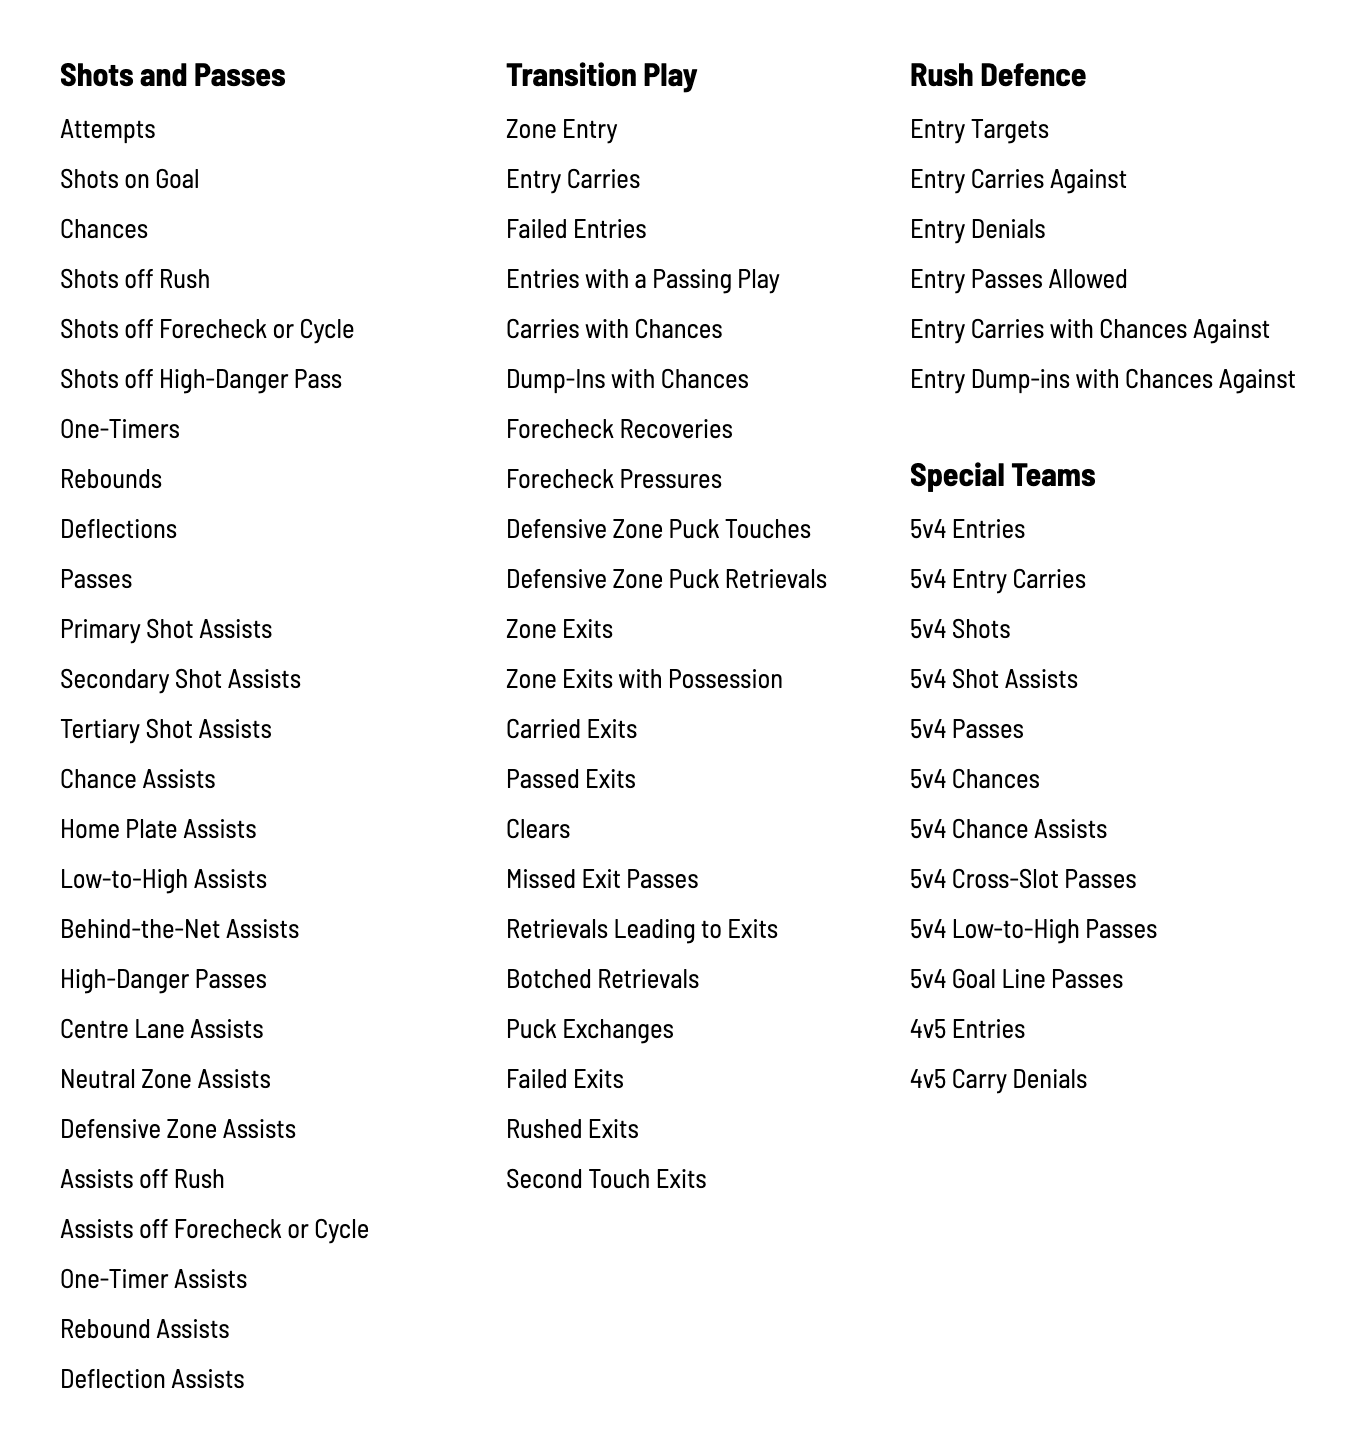
To give some perspective on the level of detail we're talking about here, this is a list of the metrics Corey has been tracking for the 2022-23 season:

Sznajder was kind enough to agree to answer my questions about his data, how to interpret it, and what he's learned from his tracking project for this two-part series.
Because the story of his tracking and his process has been well-covered, I wanted to focus on more detailed questions that have been nagging me as I've worked with his data and how best to use it.
